Mastering Accurate Trend Line Drawing in Analysis
# Mastering the Art of Drawing Accurate Trend Lines
Drawing accurate trend lines is a fundamental skill for anyone involved in technical analysis in various markets such as forex, stocks, and cryptocurrencies. These lines help traders and analysts forecast the future direction of market prices by connecting specific points on charts, typically the high and low price points over a given period. This article dives deep into the essence of drawing trend lines accurately to enhance your market analysis and prediction accuracy.
Understanding Trend Lines
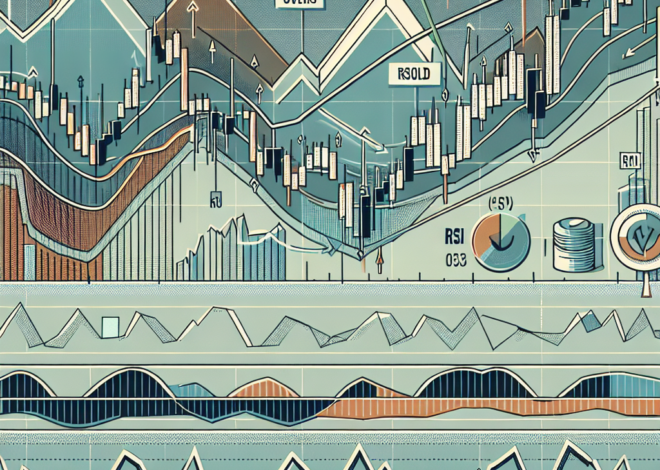
Trend lines are straightforward yet powerful technical analysis tools. They are drawn on charts to connect a series of prices, highlighting the direction of the market trend. An upward trend line is drawn by connecting the lowest lows of the price action, indicating support where prices are unlikely to fall below. Conversely, a downward trend line is drawn by connecting the highest highs, acting as resistance levels that prices are unlikely to surpass.
Steps for Drawing Accurate Trend Lines
Drawing trend lines may seem simple, but accuracy is key for effective market analysis. Follow these steps to ensure your trend lines are as accurate as possible.
Step 1: Select the Right Chart Time Frame
Different trading strategies require different time frames. Swing traders might prefer longer time frames such as daily or weekly charts, while day traders might look at shorter time frames like hourly or 4-hour charts. The chosen time frame can significantly affect where you draw your trend lines, as they should connect the relative highs and lows based on your trading horizon.
Step 2: Identify Major Highs and Lows
For an uptrend line, identify significant low points on your chart where the price bounced upwards. For a downtrend line, find significant high points where price reversed from an upward to a downward trajectory. Remember, the more points a trend line touches without breaking, the stronger and more significant the trend line is considered.
Step 3: Connect the Dots
Using a straight line tool available in most charting software, connect at least two major lows for an uptrend line, or two major highs for a downtrend line. If the line extends into the future without intersecting through candles or bars (in the case of candlestick or bar charts), it is considered valid. The best trend lines touch more than two points, enhancing their reliability.
Step 4: Adjust for Best Fit
Sometimes, perfectly connecting every point isn’t possible. In such cases, aim for the ‘best fit’ which might mean ignoring minor fluctuations to maintain the integrity of the overall trend direction. The goal is to capture the essence of the trend.
Step 5: Confirm the Trend Line’s Validity
A trend line is confirmed if the price action respects it by bouncing off the line (in the case of a support trend line) or retracting from it (in the case of a resistance trend line) multiple times. The more times the price touches the trend line without breaking it, the stronger and more significant the trend line becomes.
Common Mistakes to Avoid
While drawing trend lines, several common errors can lead to inaccurate analysis. Avoid overly adjusting your lines to fit the market; the trend line should naturally conform to the price action, not the other way around. Also, ensure not to rely solely on trend lines for trading decisions. It’s crucial to consider other factors and indicators in your analysis for a more comprehensive market outlook.
Conclusion
Drawing accurate trend lines is both an art and a science that requires practice and a keen eye for detail. By following the steps outlined above and avoiding common mistakes, you can enhance your technical analysis and make more informed trading decisions. Remember, no indicator, including trend lines, works all the time; they are tools to help you gauge the market’s probable direction, not guarantees of future price movements.