Mastering Advanced Candlestick Patterns for Trading
# Advanced Candlestick Patterns: A Guide for Traders
Candlestick patterns are a crucial tool in the arsenal of many traders, offering insights into market sentiment and potential price movements. While basic candlestick patterns are widely known and utilized, advanced patterns can provide deeper insights and higher accuracy in predicting market trends. This article dives into some of the most significant advanced candlestick patterns, explaining their structure, significance, and how to leverage them for trading decisions.
Understanding the Essence of Candlestick Patterns
Candlestick patterns are graphical representations of price movements in a market, typically over a short period. Each candlestick illustrates the open, high, low, and close (OHLC) prices for the period. Traders use these patterns to predict future market behavior based on past and present price actions. Advanced patterns build on basic ones by incorporating more candles and complex formations, offering nuanced insights into market dynamics.
Three-Drive Pattern
The Three-Drive pattern is a predictive, harmonic pattern indicating a reversal in the current trend. It is typically found at the end of bullish or bearish trends and consists of three consecutive price movements. This pattern mirrors the rhythm of the market, capturing the natural ebb and flow of buying and selling pressures.
How to Identify the Three-Drive Pattern
– Look for a pattern that consists of three distinct moves, with two retracements.
– Each “drive” should conform to specific Fibonacci levels.
– The pattern resembles a 5-wave sequence where the third drive completes near a Fibonacci extension level of the first drive.
Gartley Pattern
The Gartley pattern, another harmonic pattern, is complex and requires precise measurements to identify. It combines trend and Fibonacci retracements to pinpoint potential reversal points in the market.
Identifying the Gartley Pattern
– The pattern starts with a significant high or low (X), followed by a retracement (A), a move back in the direction of the initial trend (B), another retracement (C), and finally a move in the direction of the initial move, completing the pattern (D).
– The specific Fibonacci levels between these points help identify the pattern.
Engulfing Pattern
Though it may seem fundamental, the Engulfing pattern in certain contexts and formations, especially when combined with other indicators, can offer advanced insights into market reversals.
Criteria for the Engulfing Pattern
– A reversal pattern, consisting of two candles.
– The second candle ‘engulfs’ the body of the first one, indicating a strong shift in market sentiment.
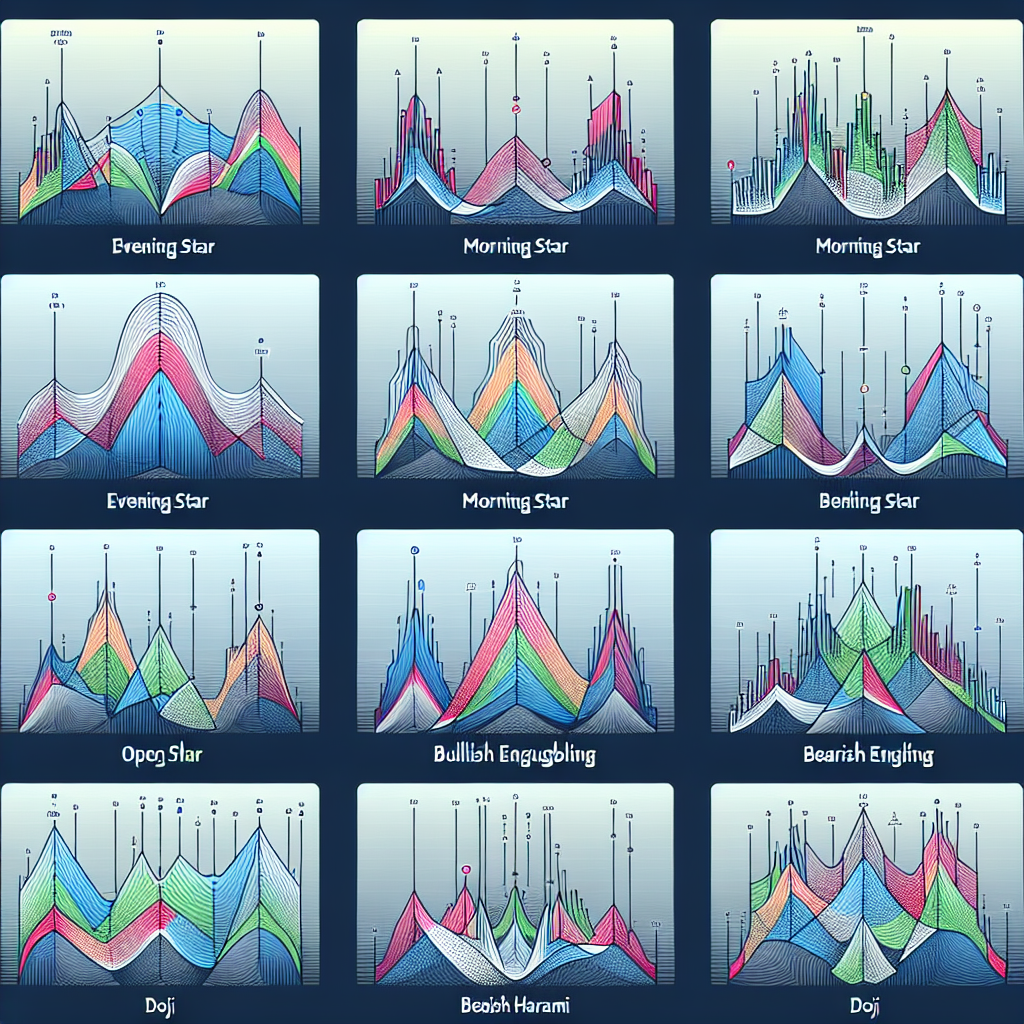
Evening and Morning Stars
The Evening and Morning Star patterns symbolize reversal indicators at the end of bullish and bearish trends, respectively. These require three candles for formation and offer a vivid picture of shifting market psychology.
Spotting the Stars
– An Evening Star formation occurs after an uptrend, featuring a long bullish candle, followed by a gap up and a small-bodied candle, then another gap down leading to a long bearish candle.
– The Morning Star pattern is the inverse, marking the end of a downtrend.
Practical Application of Advanced Candlestick Patterns
Traders can apply these advanced candlestick patterns by combining them with other technical analysis tools for more robust trading strategies. It’s advisable to confirm patterns with volume indicators, moving averages, or other technical indicators to enhance the accuracy of your predictions.
Conclusion
While advanced candlestick patterns are a powerful tool for traders, their effectiveness increases when used in conjunction with a comprehensive trading strategy. Mastery of these patterns requires practice and an understanding of market context, making them an invaluable asset for those willing to delve into the complexities of market analysis. Incorporating these patterns into your trading approach can significantly enhance decision-making processes, helping to identify potential market reversals and continuation signals more accurately.