Mastering Elliott Wave Analysis in Trading
# Elliott Wave Analysis Methods
Elliott Wave analysis is a method of technical analysis that traders use to forecast market trends by identifying extremes in investor psychology, highs and lows in prices, and other collective factors. Developed by Ralph Nelson Elliott in the 1930s, it’s premised on the notion that financial markets move in repetitive cycles, which reflect the prevailing emotion of the investing public due to external influences or the predominant psychology of the masses at the time.
Understanding the Basics
Elliott proposed that market prices unfold in specific patterns, which he called “waves”. The essence of Elliott waves is that prices alternate between impulsive phases that establish the trend and corrective phases that retrace the trend. In its simplest form, the theory states that market trends unfold in five waves in the direction of the trend followed by three corrective waves (a “5-3” move). This fractal nature means the structure is repetitive, regardless of the scale. Thus, a single cycle may well consist of smaller subsidiary waves.
The Structure of Wave Patterns
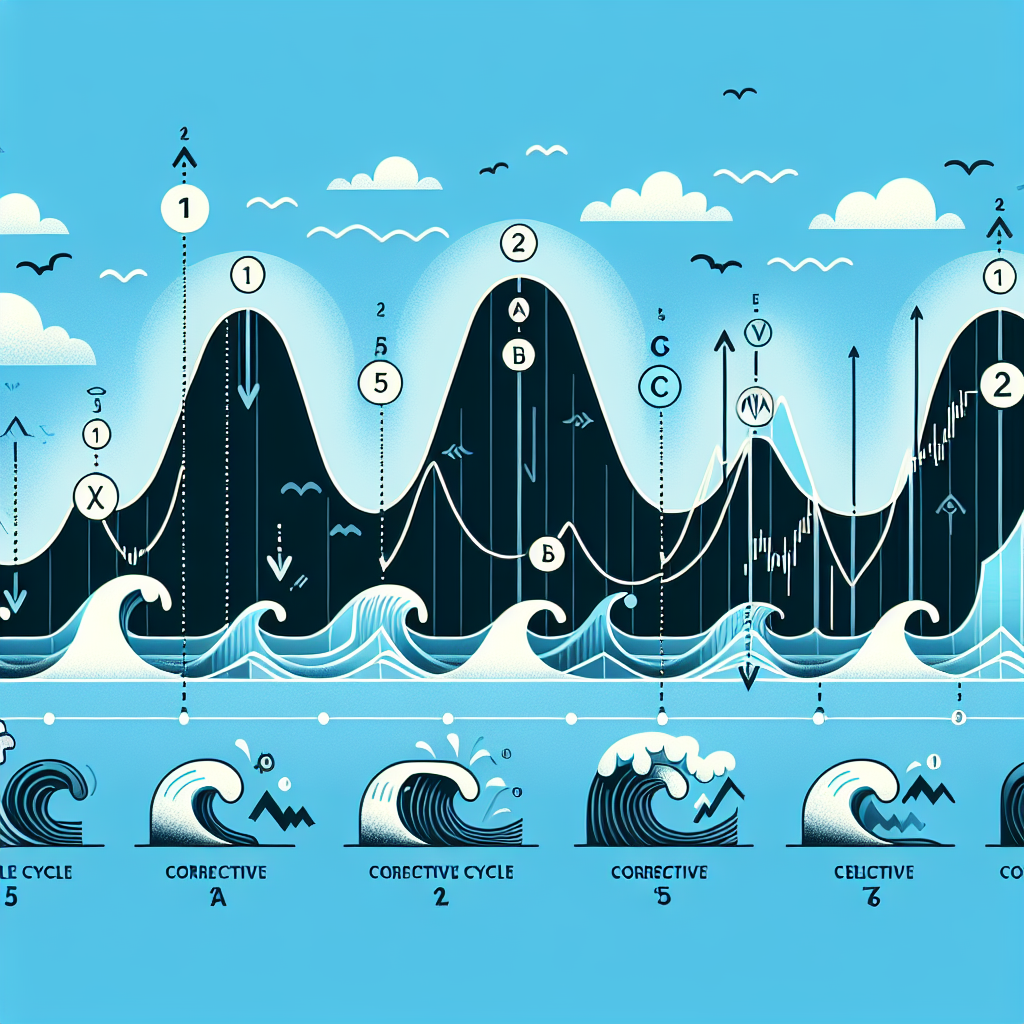
The Elliott Wave structure is divided into two main phases: the motive phase, which moves with the main trend and consists of five waves, and the corrective phase, which moves against the trend and consists of three waves.
Motive Waves
Motive waves are labeled as Waves 1, 2, 3, 4, and 5. Waves 1, 3, and 5 are impulsive, moving in the direction of the trend, while Waves 2 and 4 are corrective.
Corrective Waves
Corrective waves are labeled as Waves A, B, and C. These waves typically unfold in a 5-3-5 structure, where Wave A consists of 5 smaller waves, Wave B consists of 3 smaller waves, and Wave C consists of 5 smaller waves, moving against the trend set by the motive phase.
Rules of Elliott Wave Analysis
For an Elliott Wave analysis to be considered valid, the wave counts must adhere to three cardinal rules:
1. Wave 2 can never retrace more than 100% of Wave 1.
2. Wave 3 can never be the shortest of the three impulse waves (Waves 1, 3, and 5).
3. Wave 4 can never overlap Wave 1.
Following these rules helps analysts maintain a logical framework when interpreting market movements.
Applying Elliott Wave Analysis
To effectively apply Elliott Wave analysis, traders should start by identifying the larger trend or cycle. Once the overarching direction is established, analysts can then proceed to identify the waves within that trend.
Step 1: Determine the Trend
Analyzing long-term charts can help identify the prevailing trend and the potential starting point of the wave count.
Step 2: Identify Wave Counts
Using the highs and lows of the market price movement, start counting the waves, keeping the three cardinal rules in mind.
Step 3: Forecasting
By understanding the position within the Elliott Wave sequence, traders can forecast potential future movements based on the typical outcomes of each position within the wave patterns.
Limitations of Elliott Wave Analysis
While powerful, Elliott Wave analysis is not without its criticisms and limitations. The subjective nature of wave counting can lead to different interpretations among analysts. Moreover, because the market is influenced by numerous unforeseen factors, predicting market movements with absolute certainty is impossible.
In conclusion, Elliott Wave analysis provides a structured framework for assessing market trends and forecasting future movements. However, like all analytical methods, it should be used in conjunction with other analysis techniques to validate and refine trading strategies.