Mastering Ichimoku Cloud Trading Signals
# Unveiling the Secrets of Ichimoku Cloud Trading Signals
Understanding the complexities of the stock market requires not only intuition but also a deep knowledge of specific trading tools. Among these, the Ichimoku Cloud stands out as an all-encompassing indicator that offers traders a multifaceted view of the market. This article dives into the intricacies of Ichimoku Cloud trading signals, guiding you through its components and how to interpret its signals for informed trading decisions.
Introduction to the Ichimoku Cloud
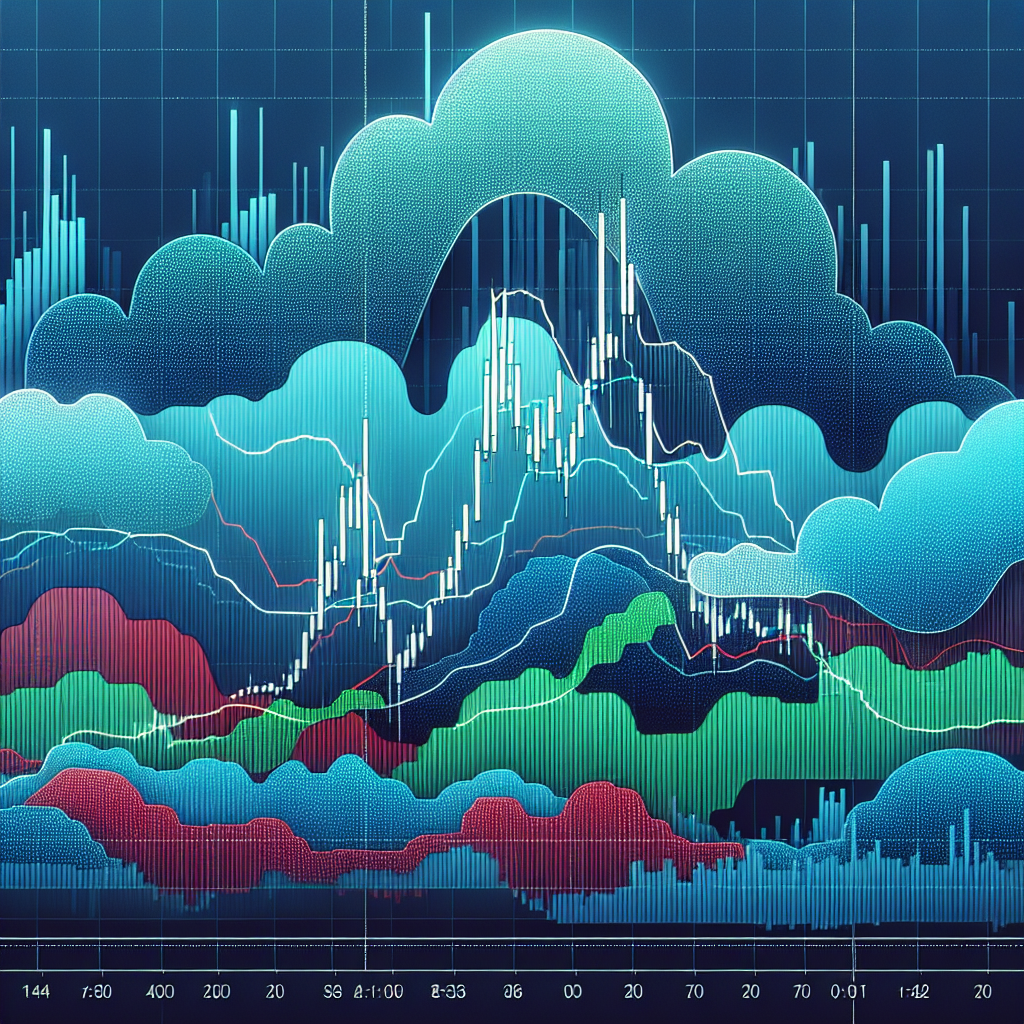
The Ichimoku Cloud, or Ichimoku Kinko Hyo, is a comprehensive indicator that provides information about support and resistance levels, momentum, and trend direction by utilizing five main components. These are the Tenkan-sen, Kijun-sen, Senkou Span A, Senkou Span B, and Chikou Span. Together, they form a “cloud” that helps predict future price movements.
Decoding the Components
Before interpreting the signals, understanding each component of the Ichimoku Cloud is crucial.
Tenkan-sen (Conversion Line)
The Tenkan-sen is calculated as the average of the highest high and the lowest low over the last 9 periods. It signifies short-term price movement.
Kijun-sen (Base Line)
The Kijun-sen, representing medium-term momentum, is the average of the highest high and the lowest low over the last 26 periods.
Senkou Span A (Leading Span A)
This is the average of the Tenkan-sen and Kijun-sen, plotted 26 periods ahead. It forms one edge of the cloud.
Senkou Span B (Leading Span B)
Calculated as the average of the highest high and the lowest low over the past 52 periods, then plotted 26 periods into the future, it forms the other edge of the cloud.
Chikou Span (Lagging Span)
The Chikou Span is the closing price plotted 26 periods back. It provides insight into past price movements.
Interpreting Ichimoku Signals for Trading
Identifying Trend Direction
The trend direction is easily identified through the position of the price in relation to the cloud. When the price is above the cloud, it signals an uptrend. Conversely, if the price is below the cloud, it indicates a downtrend.
Assessing Momentum
A crossover between the Tenkan-sen and Kijun-sen can signal a change in momentum. Specifically, when the Tenkan-sen crosses above the Kijun-sen, it is considered a bullish signal. A bearish signal, on the other hand, is emitted when the Tenkan-sen crosses below the Kijun-sen.
Identifying Support and Resistance Levels
The cloud itself acts as a dynamic support and resistance level. The top boundary of the cloud can act as the first line of resistance during uptrends, while the bottom boundary provides support during downtrends.
Signs of Breakouts
When the price moves outside the cloud, it often signals a potential breakout. A move above the cloud suggests a strong bullish trend, whereas a drop below the cloud may indicate a bearish trend beginning.
Applying the Ichimoku Cloud in Your Trading Strategy
To effectively utilize the Ichimoku Cloud, consider integrating it with other indicators and analyses for confirmation. Remember, no single indicator provides all the answers. The Ichimoku Cloud is most powerful when combined with a thorough understanding of market dynamics and a clear trading strategy.
Conclusion
The Ichimoku Cloud offers a holistic view of the market’s future direction, momentum, and support/resistance levels through its unique combination of indicators. By mastering how to interpret these signals, traders can make more informed decisions, enhancing their ability to navigate the complexities of the stock market successfully.