Mastering Trade Signals with the MACD Indicator
Using MACD for Trade Signals
The Moving Average Convergence Divergence (MACD) is a powerful trading tool that can provide potential buy and sell signals. It is a trend-following momentum indicator that shows the relationship between two moving averages of a security’s price. In this article, we will delve into how to use MACD for trade signals.
What is MACD?
MACD is a technical analysis indicator that traders use to identify potential buy and sell opportunities. It is calculated by subtracting the 26-period Exponential Moving Average (EMA) from the 12-period EMA. The result is the MACD line. A nine-day EMA of the MACD, called the “signal line,” is then plotted on top of the MACD line, which can function as a trigger for buy and sell signals.
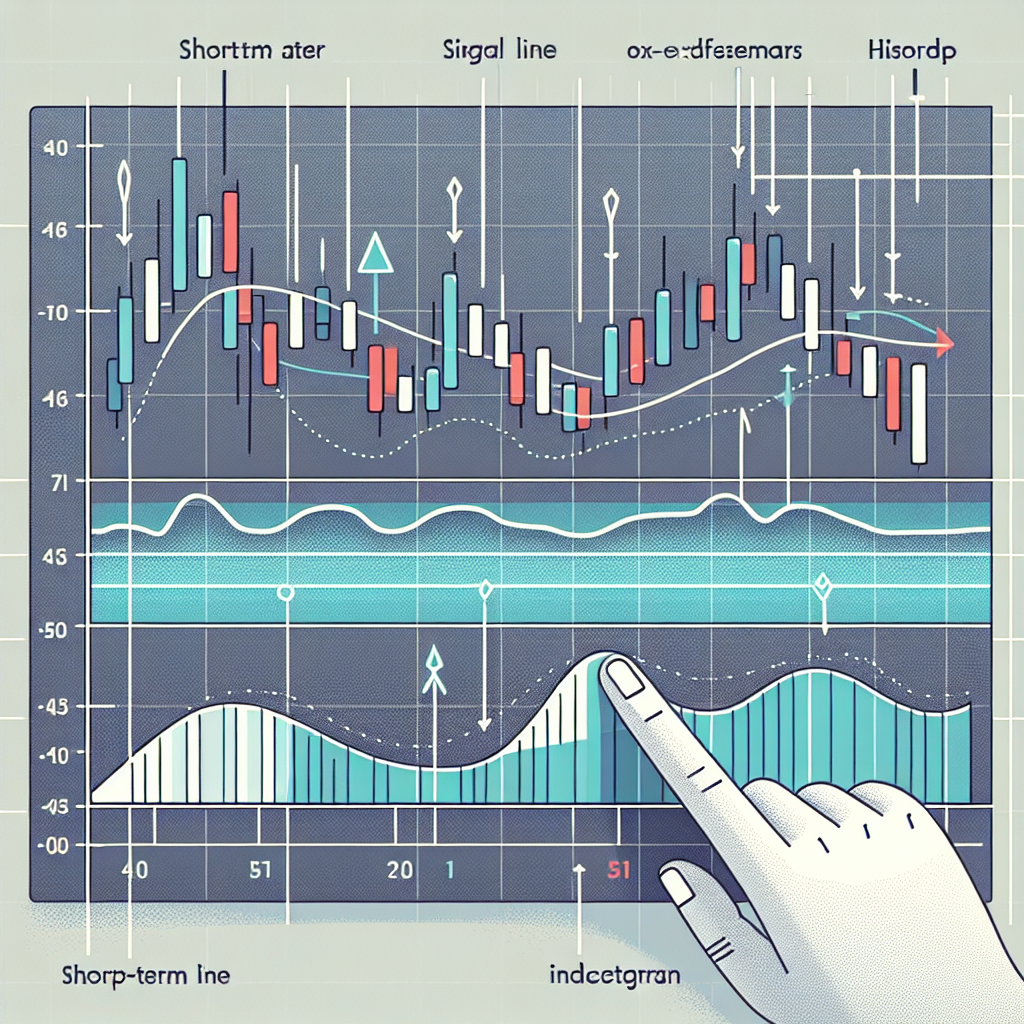
Understanding the MACD Indicator
MACD Line
The MACD line is the heart of the indicator and by default, it’s the difference between the 12-period EMA and the 26-period EMA.
Signal Line
The signal line is an EMA of the MACD line. The standard setting is a 9-period EMA, but this can be adjusted to suit different trading styles.
Histogram
The MACD histogram is an elegant visual representation of the difference between the MACD line and the signal line. A positive histogram indicates that the MACD line is above the signal line, while a negative histogram shows the MACD line below the signal line.
Using MACD for Trade Signals
Traders use the MACD indicator in several ways to generate trade signals.
1. Crossover
When the MACD line crosses above the signal line, it generates a bullish signal, indicating that it may be an opportune time to buy. Conversely, when the MACD line crosses below the signal line, it generates a bearish signal, suggesting that it may be an appropriate time to sell.
2. Divergence
When the price of an asset is moving in the opposite direction of the MACD histogram, it is known as divergence. This can be a sign that the current trend is weakening and could potentially reverse.
3. Dramatic Rise or Fall
If the MACD rises dramatically – that is, the shorter moving average pulls away from the longer-term moving average – it’s a signal that the asset is overbought and will soon return to normal levels. Traders watch for a move below the zero line as a signal that the asset may be due for a pullback.
Conclusion
The MACD is a versatile tool that can help traders identify potential buy and sell opportunities. However, like all trading indicators, it should be used in conjunction with other forms of analysis and should not be relied upon exclusively. Always remember that while MACD can provide a good indication of a trend, it does not guarantee success and traders should always manage their risk appropriately.